Purpose
This is my first data science project where I have compiled data Greenville, SC’s Swamp Rabbit Trail Survey data and Industry Growth by Employees in the workforce to evaluate any potential for correlation of having a bike/walk trail can stimulate economic growth for a Metro area.
A little background
Greenville South Carolina is located near the upper northwest of the state. It is the largest county in the state and is growing both in population and economically. Greenville’s growth and influence has been a stimulating force to its surrounding city and county neighbors as well.
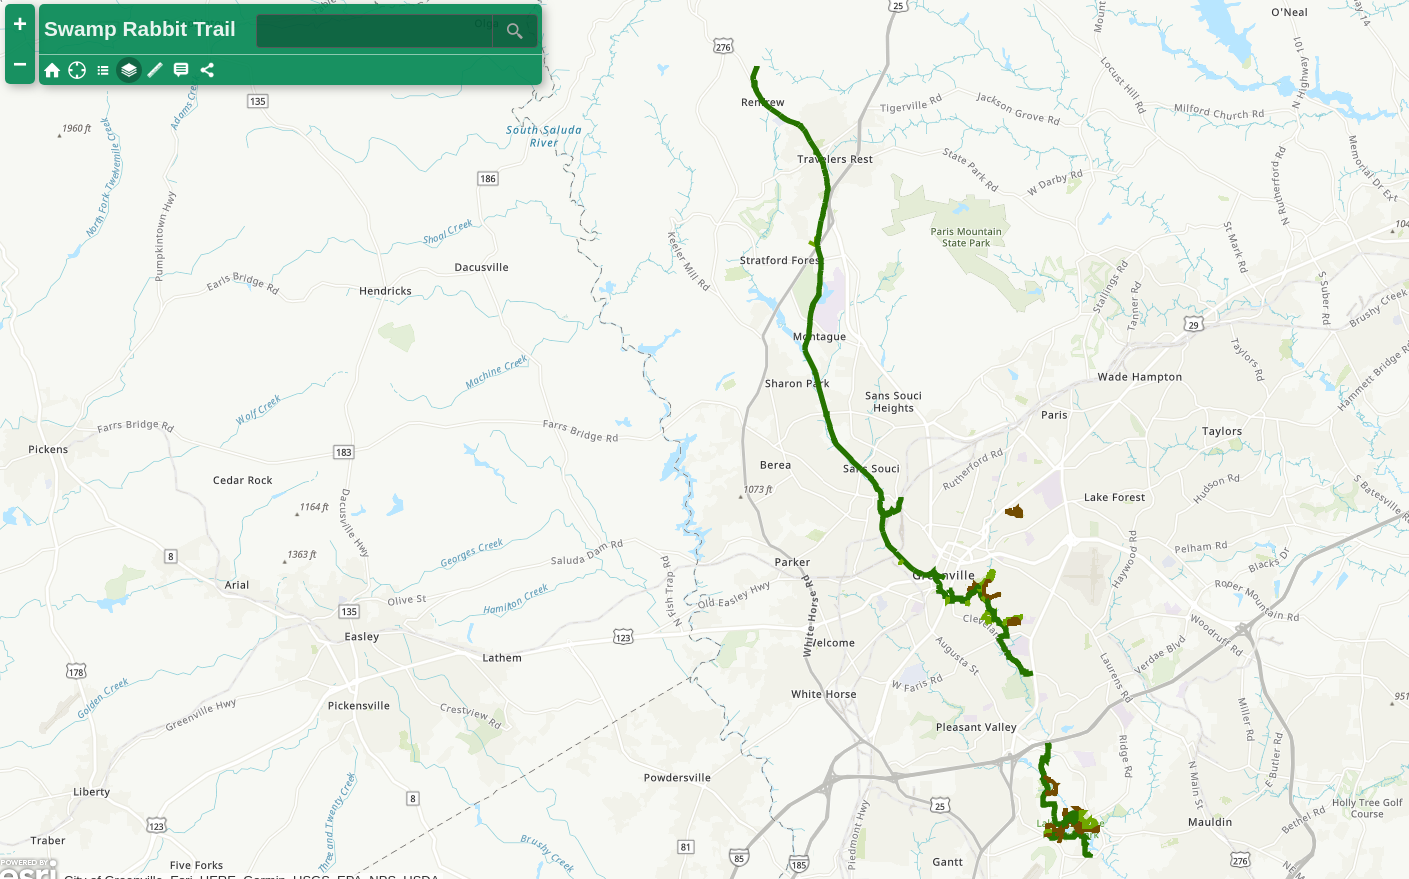
One of the factors in Greenville’s growth is the Swamp Rabbit Trail. The Swamp Rabbit Trail is a 22 mile multi-use (walking & bicycling) connected greenway network that traverses along the Reedy River. It is an old railroad corridor that connects Greenville city parks to Travelers Rest.
The trail opened up in 2009 and is one of the most popular recreational attractions in the Greenville Metro area. It has been so inspirational that the surrounding counties of Pickens, Anderson, and Spartanburg have also implemented either bike paths or trails. Both the Doodle Trail in Pickens County connecting the cities Easley to Pickens and the Swamp Rabbit Trail were inspired by the Rails to Trails initiative where communities are repurposing no-longer used train rail routes and converting them to bike/walk trails. Spartanburg has established an in-town bike path system called Bike Town that has a bicycle sharing program called B-Share.
Here are some data points
Greenville’s Swamp Rabbit Trail had a survey conducted that ran from 2011 to 2014 to analyze the community Impact. Here is an infographic from that study:

My Swamp Rabbit Trail Impact Analysis
Using data from the Greenvile Rec’s Google Drive I created a this Dataframe:
import matplotlib.pyplot as plt
import pandas as pd

traildata = pd.read_csv('https://raw.githubusercontent.com/standroidbeta/DS-Unit-1-Sprint-5-Data-Storytelling-Blog-Post/master/DS-Unit-1-Sprint-5-Data-Storytelling-Data/Swamp-Rabbit%20Economic-Impact-Results.csv')
traildata

traildata = traildata.drop(columns=['Users Outside of Greenville County',	'Percentage Outside of Greenville County',
                                    'Users outside 50 mile radius of 29617',	'Percentage of Out of County Users that are outside a 50 mile Radius',
                                    'Percentage of Total Users that are outside a 50 mile radius'])
traildata
| Greenville Health System Swamp Rabbit Survey Year | Total Users | Total Economic Impact |
|---|---|---|
| 2011 | 359314 | 3232389 |
| 2012 | 461299 | 3858397 |
| 2013 | 501236 | 4855974 |
| 2014 | 501236 | 6974198 |
| 2015* | 572197 | 7785991 |
| 2016* | 618767 | 9008291 |
Note: Years 2015 and 2016 were not a part of the survey. The values reflected for those years are predicted values since the data for those years is not available.
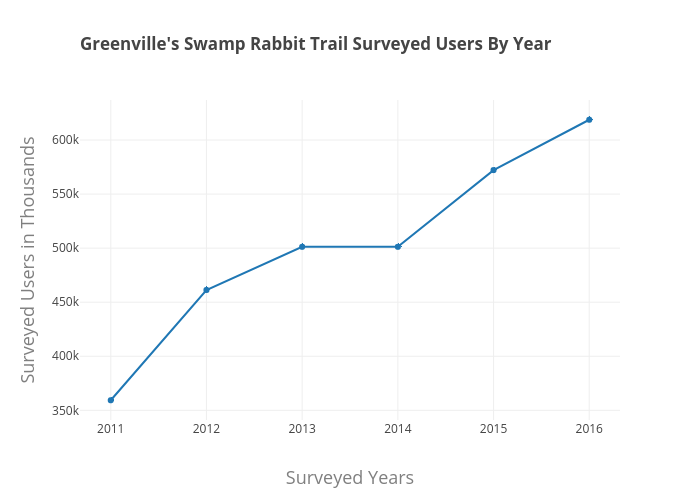
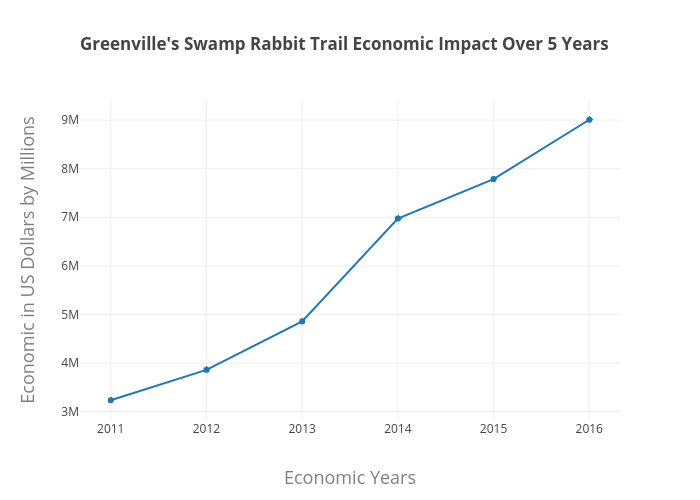
Using the data, I used Plotly (because of its interactive tools) and to code one line graph to show the growth of path usage and the other to show economic impact.
Swamp Rabbit Trail Use Code
trace = go.Scatter(
    x = traildata[['Greenville Health System Swamp Rabbit Survey Year']],
    y = traildata[['Total Users']]
)

data = [trace]
layout = go.Layout(
    title=go.layout.Title(
        text="<b>Greenville's Swamp Rabbit Trail Surveyed Users By Year</b>",
        xref='paper',
        x=0
    ),
    xaxis=go.layout.XAxis(
        title=go.layout.xaxis.Title(
            text='Surveyed Years',
            font=dict(
                size=18,
                color='#7f7f7f'
            )
        )
    ),
    yaxis=go.layout.YAxis(
        title=go.layout.yaxis.Title(
            text='Surveyed Users in Thousands',
            font=dict(
                size=18,
                color='#7f7f7f'
            )
        )
    )
)
fig = go.Figure(data=data, layout=layout)
py.iplot(fig, filename='Traildata Users-line')
Swamp Rabbit Trail Use Graph
Swamp Rabbit Trail Use Code
trace = go.Scatter(
    x = traildata[['Greenville Health System Swamp Rabbit Survey Year']],
    y = traildata[['Total Economic Impact']]
)

data = [trace]
layout = go.Layout(
    title=go.layout.Title(
        text="<b>Greenville's Swamp Rabbit Trail Economic Impact Over Six Years</b>",
        xref='paper',
        x=0
    ),
    xaxis=go.layout.XAxis(
        title=go.layout.xaxis.Title(
            text='Economic Years',
            font=dict(
                size=18,
                color='#7f7f7f'
            )
        )
    ),
    yaxis=go.layout.YAxis(
        title=go.layout.yaxis.Title(
            text='Economic in US Dollars by Millions',
            font=dict(
                size=18,
                color='#7f7f7f'
            )
        )
    )
)
fig = go.Figure(data=data, layout=layout)
py.iplot(fig, filename='Traildata Users-line')
Swamp Rabbit Trail Economic Graph
The Economic data in used in with is data is based on the this survey report summary as follows:
Summary of Business Interviews for Year 4
Nineteen managers/owners of retail businesses directly abutting and/or within close proximity to a GHS SRT access point were interviewed in Year 3, however this number increased to 27 in Year 4, including six retail bicycle shops.
Selection criteria for the business interviews were as follows in Year 4:
- Retail business (i.e., food/entertainment; clothing/equipment; services).
- Must directly abut GHS SRT or be located within 250 yards of a GHS SRT access point. The trail segment for the business interviews was from Travelers Rest to Linky Stone Park in downtown Greenville.
Questions for the business interviews in Year 4, similar to Years 1-3 were taken from Stewart and Barr 4 examining promotion methods used by hospitality-related firms in close proximity to rail/trails. The business interviews were primarily designed to determine: If businesses located near the GHS SRT access points have observed any change in business after the trail was built?
Overall, the GHS SRT has a significant impact on business since inception. The managers/owners interviewed in Year 4 were asked a host of questions with the focus on the advantages and disadvantages of having a business in close proximity to the GHS SRT.
- The businesses surveyed in Year 4 reported increases in sales/revenue ranging from 10% to as high as 100% with an average of 40% of sales/revenue linked to trail users.
- Many new businesses opened their doors in Year 4 specifically selecting a site in close proximity to GHS SRT.
My Assertions of the trail data alone
I find it interesting that although trail usage did not change at all between the years 2013 and 2014, the revenue of the retail businesses continued to grow. I believe that this is a strong indication of people moving to the area finding financial stability and growth.
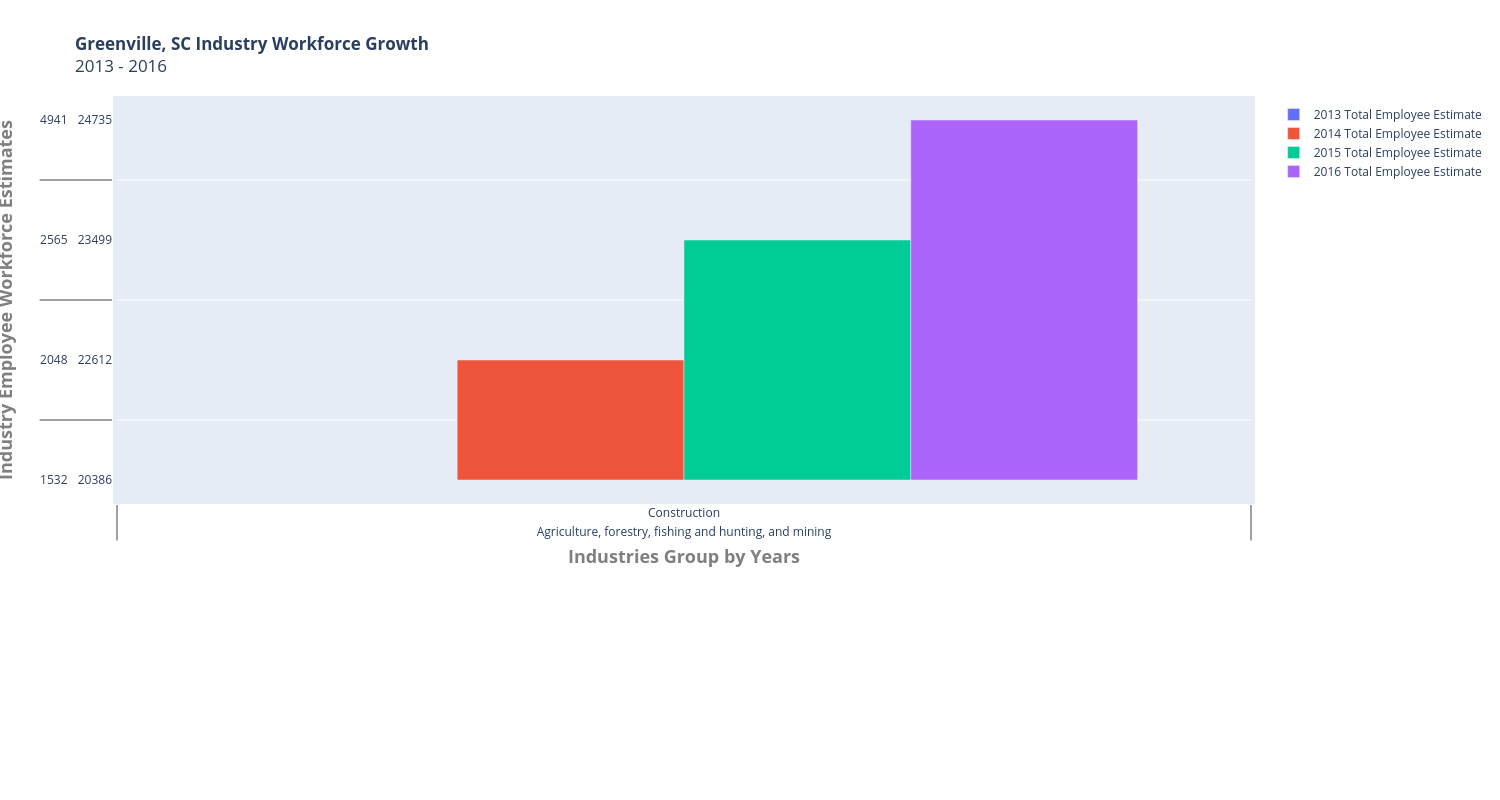
Greenville’s economic growth by industry workforce analysis
For this data, I sourced it from the US Census website for the years of 2013-2016. Here is the dataframe that that I used:
url = 'https://raw.githubusercontent.com/standroidbeta/DS-Unit-1-Sprint-5-Data-Storytelling-Blog-Post/master/DS-Unit-1-Sprint-5-Data-Storytelling-Data/2013-2016-ACS-Estimates-Greenville-Metro.csv'

greenville = pd.read_csv(url)

greenville

greenville_est = greenville[['Industry', '2013 Total Employee Estimate', '2014 Total Employee Estimate',
                            '2015 Total Employee Estimate', '2016 Total Employee Estimate']]

greenville_est
Greenville Industry Workforce Growth Dataframe
| Industry | 2013 Total Employee Estimate | 2014 Total Employee Estimate | 2015 Total Employee Estimate 2016 | Total Employee Estimate |
|---|---|---|---|---|
| Agriculture, forestry, fishing and hunting, and mining | 1532 | 2048 | 2565 | 4941 |
| Construction | 20386 | 22612 | 23499 | 24735 |
| Manufacturing | 69640 | 70226 | 77771 | 76038 |
| Wholesale trade | 11753 | 15808 | 10103 | 11980 |
| Retail trade | 41161 | 45191 | 42335 | 49169 |
| Transportation and warehousing, and utilities | 15582 | 15725 | 15451 | 17678 |
| Information | 6842 | 5777 | 9376 | 5561 |
| Finance and insurance, and real estate and rental and leasing | 18941 | 18533 | 20604 | 21543 |
| Professional, scientific, and management, and administrative and waste management services | 37180 | 41816 | 40285 | 45559 |
| Educational services, and health care and social assistance | 85060 | 82924 | 88745 | 88454 |
| Arts, entertainment, and recreation, and accommodation and food services | 39696 | 37300 | 34119 | 37026 |
| Other services, except public administration | 18761 | 20273 | 20591 | 22097 |
| Public administration | 11325 | 11051 | 11225 | 9388 |
Greenville Industry Workforce Growth Graph
Conclusion
-
Due there being a steady Industry Workforce growth in Greenville, SC and steady Trail use growth. I do believe that the Swamp Rabbit Trail has positive Economic Impact.
-
Gathering up-to-date data for this project was a challenge. I found that this type of data collection and analysis does not happen and is not as complete as it could be. This is a concern because I feel that if there was more current like this to produce and publish, it can help to show that there how economically vibrant and healthy our communities are. You can also read this post with the dataset I used on my GitHub Pages site: